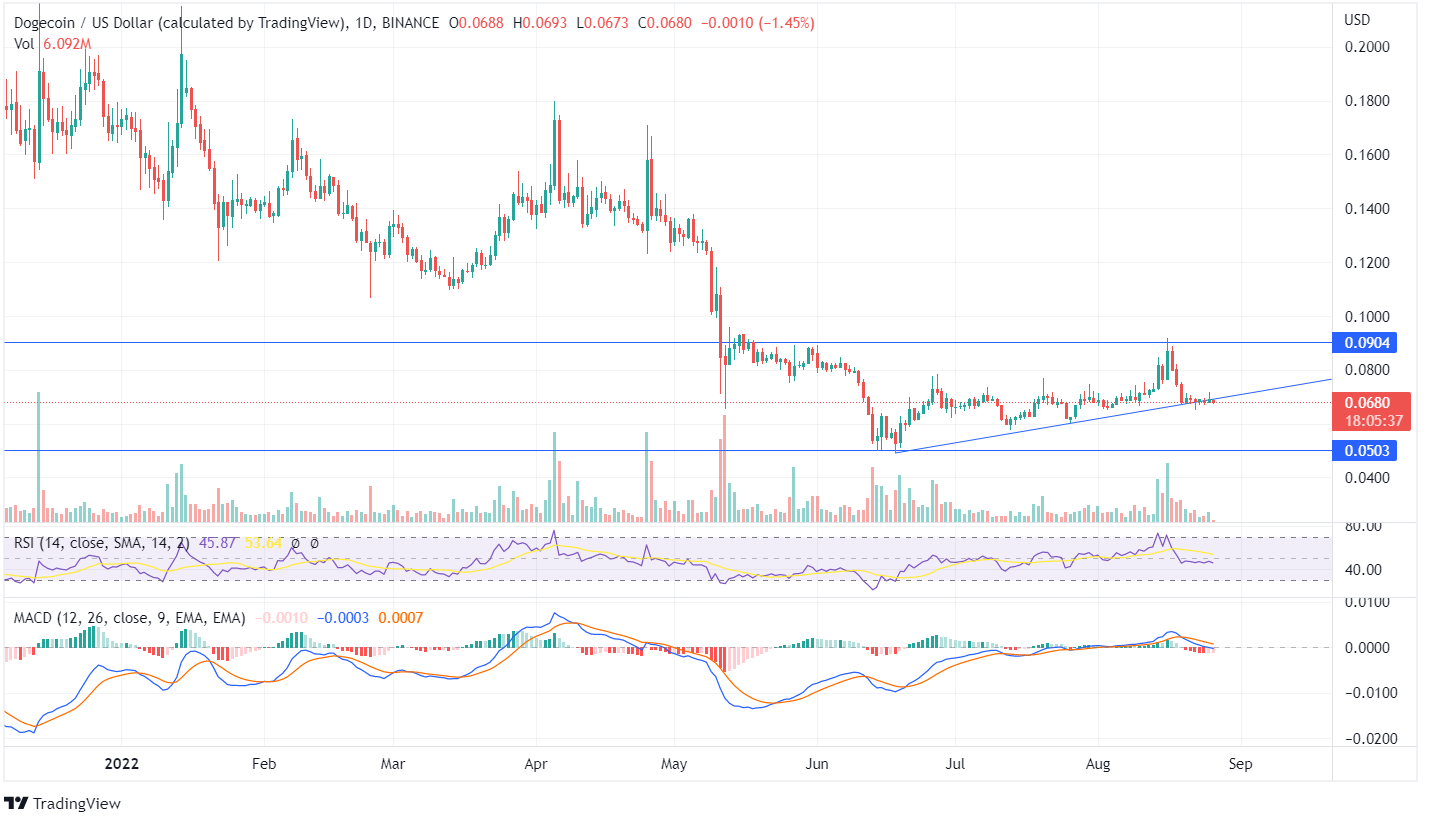
Dogecoin (DOGE) turned from its lows of $0.0503 and showed an up-trend move as the token formed a high peak, taking the support of the up-trend line. The coin currently has a market price of $0.0680 as the price moves at the edges of the trend line showing a consolidated momentum.
In the last few days, the DOGE price has been trading in a sideways momentum between $0.05 and $0.09. The price moving sideways shows indecision in the market as neither the bulls are able to close the value upside nor the bears are able to push the price downwards. Will this be the best time to invest in DOGE? Check our Dogecoin forecast to know.
The RSI line entered the overbought area recently, and the indicator being, currently 45, shows neutral price movement as RSI continues to move sideways. The MACD line below the Signal Line and the histogram showing diminishing red candles indicate a bearish signal. There was a favorable bullish volume on August 16, when the Dogecoin price reached its near resistance of $0.0904; after that, the price continued to decline significantly.
The forming weekly candle shows both the bulls and the bears had pushed the price of Dogecoin in both directions as the price is moving at the trend line and is yet to close above or below the trend line. The previous week’s candle showed a huge movement as the price reached the resistance point but couldn’t close above or near it, and a bearish candle was formed, showing a downfall in DOGE.
The MACD indicator on the weekly chart of DOGE signals a bullish trend; however, long-term investors should wait for the forming candles to confirm an upcoming trend.


