DigiByte (DGB), one of the top 50 cryptos of the market, has marked a notable All-Time High at $0.0381 in the ongoing month. DGB/USD after a stagnant momentum until April 2020 is now trading with a gain of over 2000% from the YTD bottom of $0.00130 to currently trading at $0.0300.
DGB/USD has gained enough traction in this alt season and maintains a stance above 61.80% Fib retracement level even after the intraday pullback below the recent high.
DigiByte Price Analysis
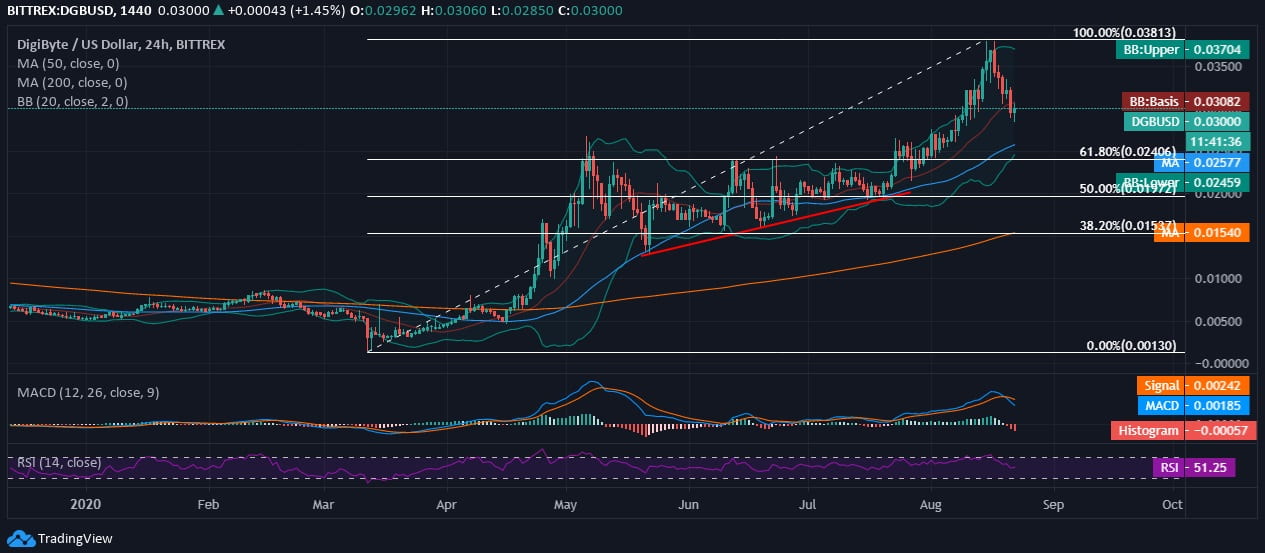
DigiByte drew a clear uptrend until the end of the previous month on the 24-hour chart against the US Dollar. After that, hitting a steep ATH at $0.038, DGB coin pulled back due to daily volatility and has been in the range after hitting the upper Bollinger band. DGB/USD holds support from SMA50 and SMA200 on the 24-hour chart at $0.025 & $0.015, respectively. The 20-day Bollinger Bands do not hold any possibility of an unprecedented volatile breakout.
The MACD chart holds a slight bearish crossover due to intraday negative bias, and therefore, the signal line is seen crossing above the MACD line on the daily chart. The RSI of DGB coin shows a fall in demand and is lying at 51.25 with no trading extremities. According to DigiByte Price Prediction and technicals, the coin might face downward correction in the upcoming days.