Ethereum Merge was completed in September, and it is running on Proof of Stake consensus for verifying transactions, increasing the scalability and energy efficiency. Now there is a concern that the SEC will introduce some regulations for Proof of Stake consensus or the entire crypto space. That is why the price of ETH has dropped significantly due to the speculations of possible regulations.
Many experts think it is an ideal time to accumulate ETH for the long term. Based on the market cap, Ethereum is the second largest cryptocurrency in the world, and some even say that it will dethrone Bitcoin in the future if it leads the next bull rally.
Some investors are happy after a successful Merge upgrade, but others had high expectations that it would lower the transaction fees. They thought faster transactions and fewer fees might attract more investors to the Ethereum network, and the price will surge in the next few months.
Optimistic investors still believe that Ethereum has long-term value, and they should treat ETH as an asset for the future because the Ethereum Merge upgrade may not influence the price for the short term, but it will provide a huge return in the long run.
Merge is an infrastructure upgrade that will help the developer add new features in the future, but all the other facilities, such as wallet, transactions, and addresses, will work the same. Users faced a few hours of downtime on many exchanges, but everything remained the same. If you want to treat Ethereum as an asset, read our Ethereum projections before investing.

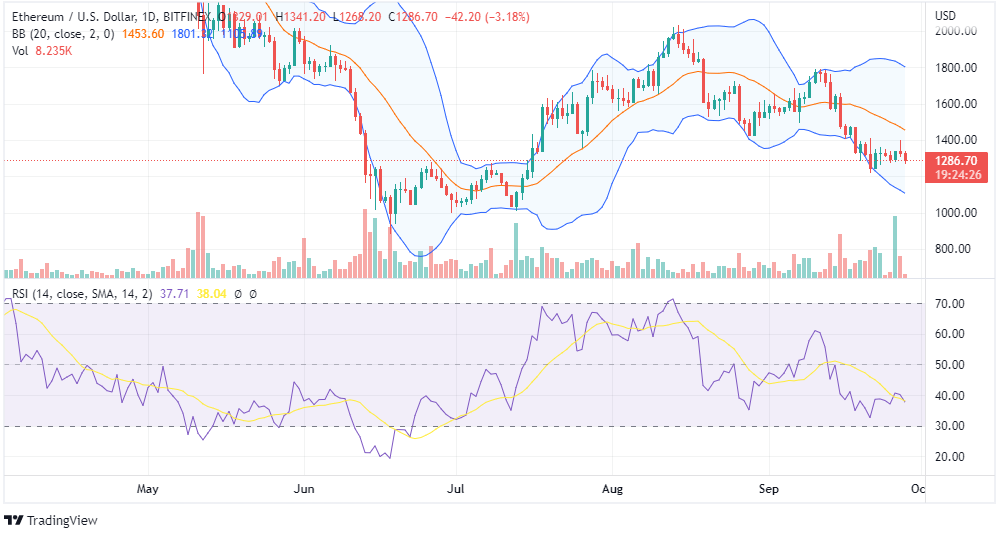
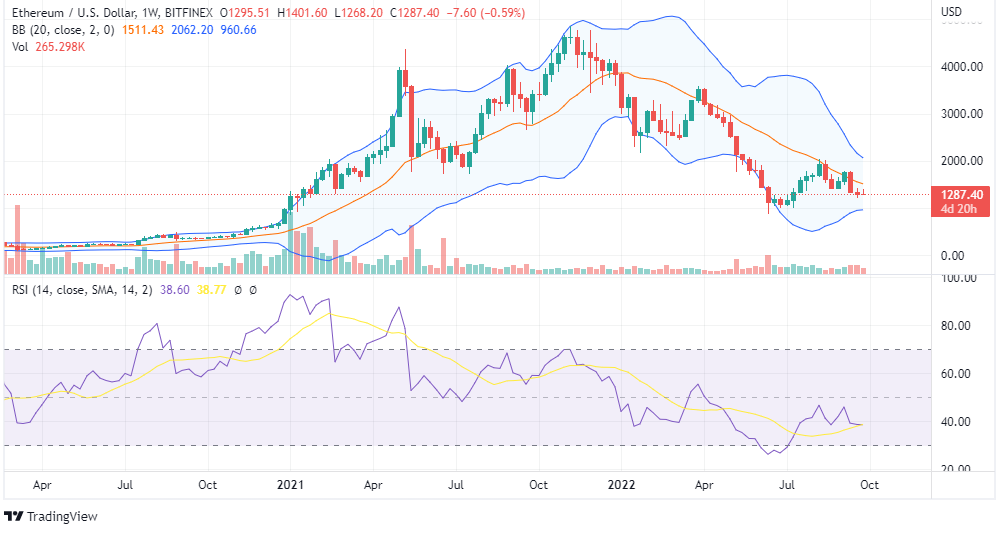
On the upside, $2000 is resistance for ETH price. Candlesticks are forming in the lower range of the BB with RSI below 40, which reflects bearishness. If you consider the candlestick pattern, it forms a red engulfing candle after a red inverted hammer, suggesting bearishness for the short term.


