

Bitcoin SV has constantly declined over the past few weeks and is currently trailing at $52. The token got rejected several times for an uptrend move and has been falling continually. The coin shows remote price movement on the weekly chart as neither the bulls nor the bears could push the price in any direction.
The technical parameters in the longer time frame chart are neutral. The BSV price is very close to its all-time low, even though the bulls tried to push it upwards but failed. The volume candles are favorable towards bears, as the May 09’s weekly candle showed a significant downfall, and the price crossed the trend line but couldn’t close above it.
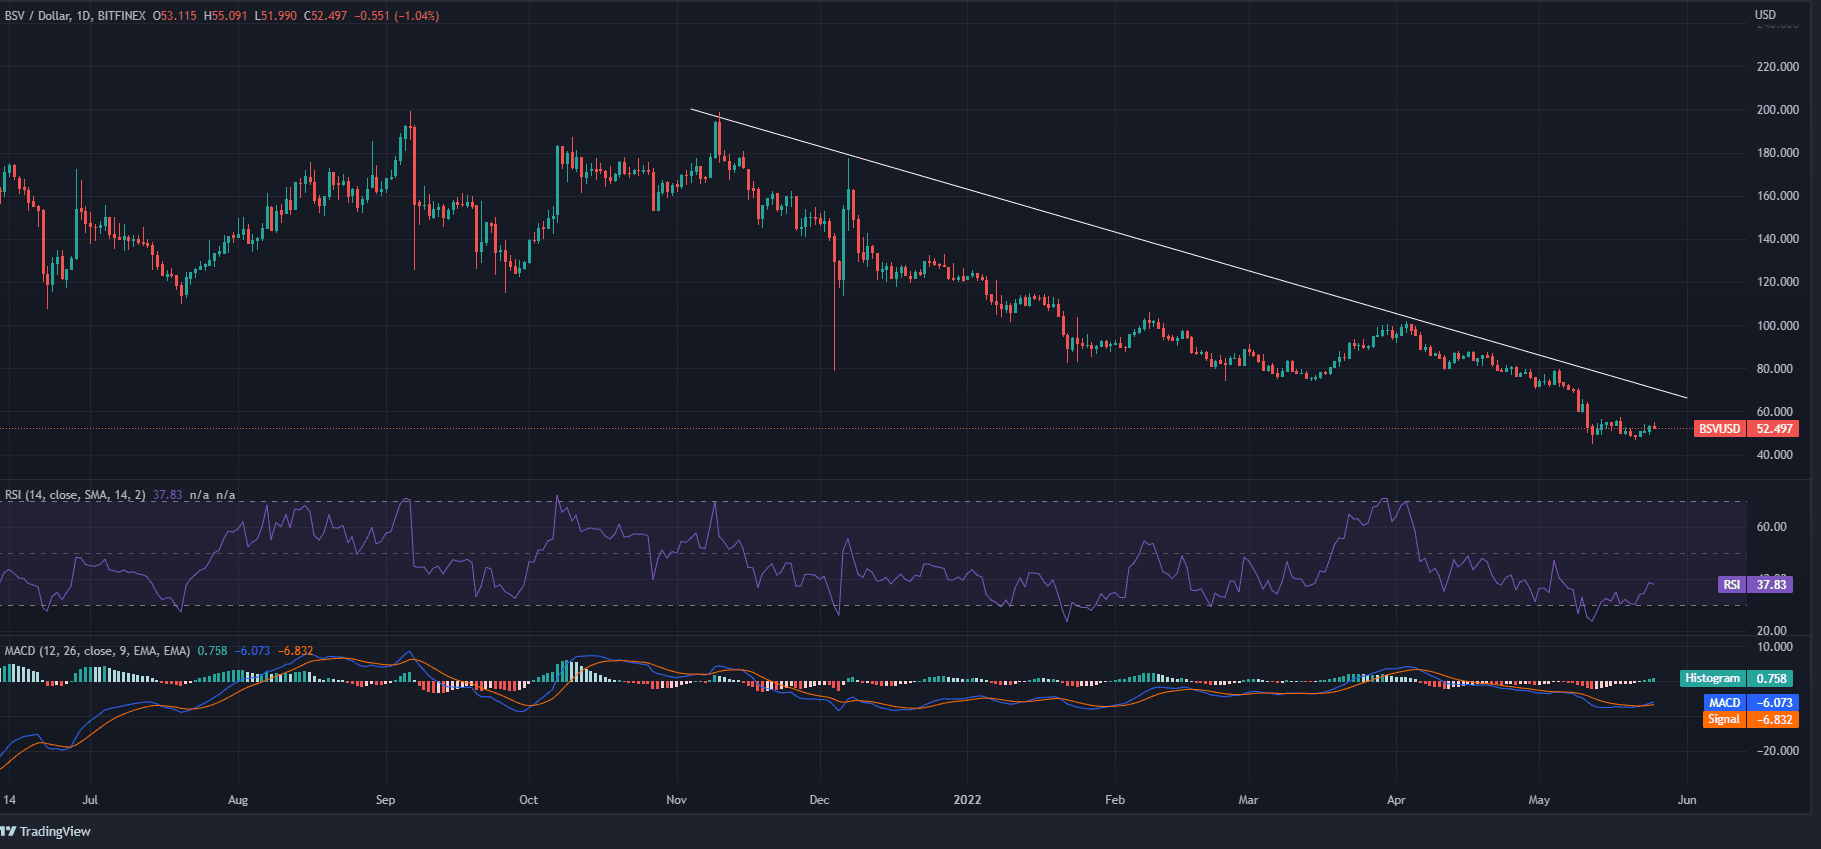
On the daily chart, the price is moving below the downtrend line, and in the last few days, the bullish candles were formed but couldn’t move up much. The MACD line on the daily chart trades above the Signal Line, denoting a bullish momentum. However, the BSV price should close above the downtrend line to confirm an uptrend move.
The BSV token is moving in consolidated momentum with remote price movement. The bulls are trying to put buying pressure but failed to take the price up. The RSI is at 58, trading in the overbought zone. The Bitcoin SV token is supressing all the support lines, and falling may be a sign of demerging coin.
The traders should wait for the trend confirmation as the price has reached its rising zone. However, the continuous fall of the Bitcoin SV coin may take it to its further downfall. A bullish opportunity can be expected once the token forms higher highs and higher lows.