

Bitcoin SV, at the time of penning down this analysis, was drawing a slight uptrend from the last week of March, having marked a 30-day bottom at $145.7. BSV has retained support from 50-day and 200-day MA as the price grew above $190 and $200. Over the past five weeks, Bitcoin SV price once crossed above $220, and it was just on the last trading day of the previous month when the coin briefly went above $230. The 20-day Bollinger Bands laid do not project volatility in the upcoming days, although, the coin itself holds a volatile nature.
Bitcoin SV Price Analysis
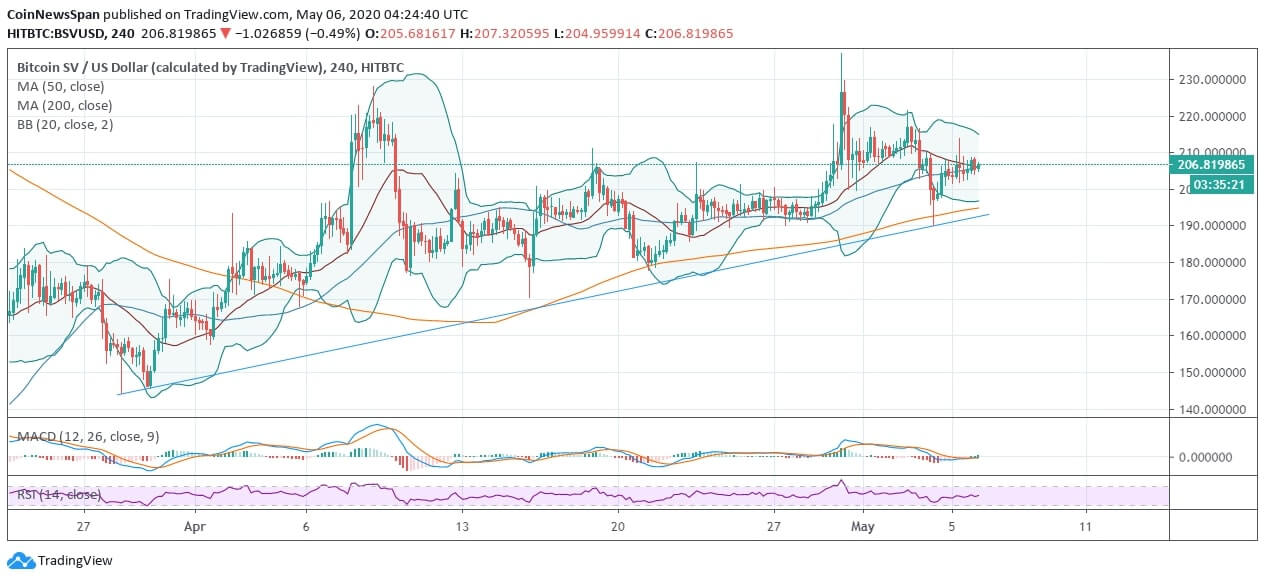
On the 4-hourly chart, BSV holds a slight bullish intraday crossover as it briefly went above $210 at the onset of the day. However, with a lack of steady momentum, the price of Bitcoin SV turned down to $206, at the time of trading, and a further dip below $205 and $200 will draw a bearish consolidation. The higher high candlestick breakout appears brief over the past month when it breached the 20-day upper Bollinger Band.
Moreover, Bitcoin is also pumped with price escalation since the start of the day, and as per Bitcoin SV forecast, we believe that is going to leave an influential spike on the altcoins, especially BCH and BSV, as the halving nears.
The MACD appears flat while appears slightly bullish due to intraday bullish opening. Yet, a complete crossover awaits, and the RSI of Bitcoin S lies around 50 with no trading extremities at present.