

One of the most well-known cryptocurrencies, Bitcoin Gold, has been trailing at its highs at the end of August after the markets have bottomed out from May to July. From June to August 2021, BTG has generated an overall profit of about 282% for its investors, and it has been an outstanding windfall return for them, thereby attaining prices at their highs.
After a downfall of around 188% till September end, Bitcoin Gold has started to regain its position with up trending candlesticks. Investors with bullish hope might have found an entry point at 58.82, where there was an upside price breakout. The triangle pattern, along with a robust support zone, is like a rollover for the investors as it’s a stretched support line coming over from March and leading the price to its highs and not permitting the prices to go short. It is clearly visible from the charts that there have been consolidated movements several times, but being above the support zone has continuously resulted in upward price movements.
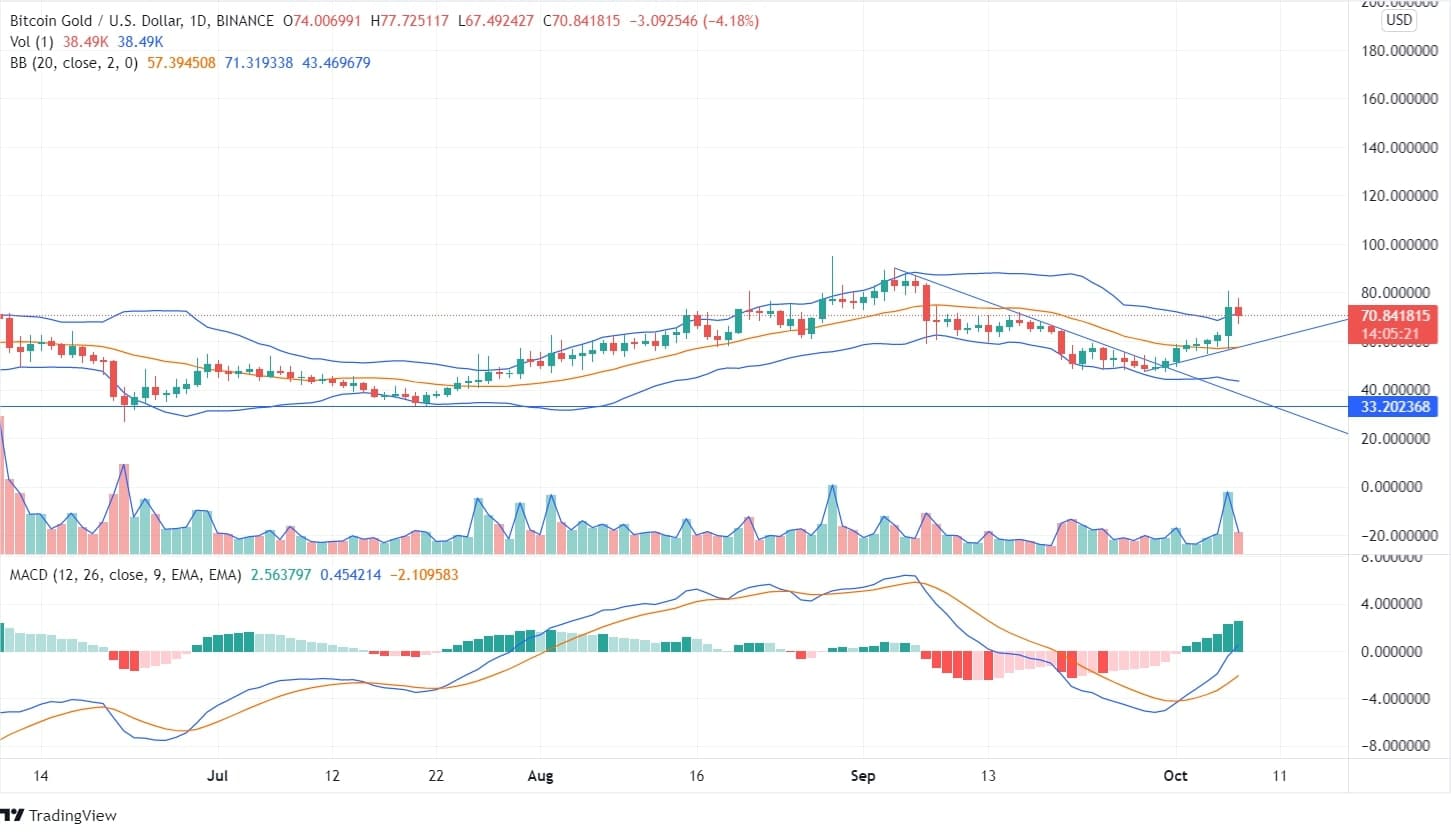 If the BTG price holds on to the bullish momentum, investors can expect a minimum of taking profit up to $94.94 with a determined stop loss of around $48.17. Furthermore, the formation of hidden bullish divergence is supplementary for long-term investors. The candlesticks are making higher highs confirming the upsurge of price subsequently from October 01. However, there has been a rejection of price by the bearish candle formed on the edge of the upper bands of Bollinger on October 07.
The MACD indicator in the daily chart is above the signal line, demonstrating to be an optimistic movement for investors with bullish hope. It also displays rising green bars in its histogram chart, supporting the uptrend move of price.
The RSI being at 62 indicates a steady and gradual rise in the upside slope and momentarily will be in its overbought zone. After reaching the highs and in the overbought zone, the price may turn around, and it might be an opportunity for bearish investors, as observed from the past.
While analyzing volume, it can be noticed that there is not much strength in bullish or bearish traders, and there is an indecision in the movement of price. The price of Bitcoin Gold is on the upper band of Bollinger can be a reversal signal. However, bands not being expanded reflect that the market is not volatile, and there can be price movement in any direction.
However, the weekly chart doesn’t support the trending move of price as the MACD line is below the signal line, and the histogram chart also shows red candles. Volume does not indicate any move of price, thus leaving the decision on the sentiment of traders.