

Bitcoin, the most popular cryptocurrency globally, has experienced another week opening for liquidation and panic selling from crypto enthusiasts. Market bleeding for the second day of the week amid the financial announcement of China and question of its legitimacy on certain large economies. The global financial market is around 1.89 billion dollars which experienced a fall of 3.65% on the last day ending.
Crypto is experiencing unpredictable price changes from the initial weekend of September onwards and continuing the same. This year has witnessed record highs and massive trading volume, after the drop of $3000, which has a continuous up move till the range of $60000 in the BTC market in July. But the current scenario shows that crypto is falling to sustain the support level. The economic news from China may also be a reason for fear of the crypto market globally.
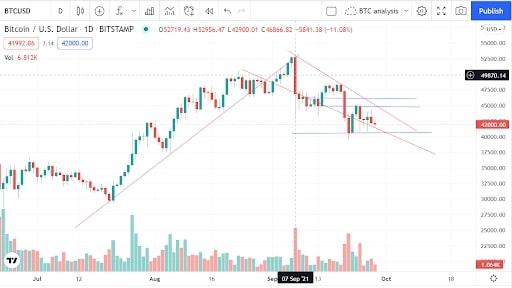 BTC has traded in the range of $41529 to $42778 for yesterday, and at ist 17:00, it is trading on $41946, trying to recover from the low of $41529 of the day. The bearish engulfing of September 7 has made a low of $39523 for the month till September 28 with a considerable volume correction of profit booking.
Half of the day has made a loss of 2.13% for the miners and recovered to 0.47% later. Near time swing low is at $39605, but the next bearish momentum after that cannot be sustained for more than two days. A further fall of $40826 has pulled back Bitcoin and created a panic situation among the traders. However, any further fall below the $41000 range may signify that buyers are not ready to take part in the next bull momentum.
From a technical standpoint, long-term Bitcoin price prediction analysis indicates a potential breakout in the coming week or October. On the weekly chart, technical indicators are ready for a breakout from the current levels.
A falling wedge formation is seen in the daily chart, which shows a chance of break out of crypto at the end. By connecting the swing lows and a reversal can touch a $52000 range for the upcoming months. But sustaining $44800 and $46850 will be a hurdle for the upmove.
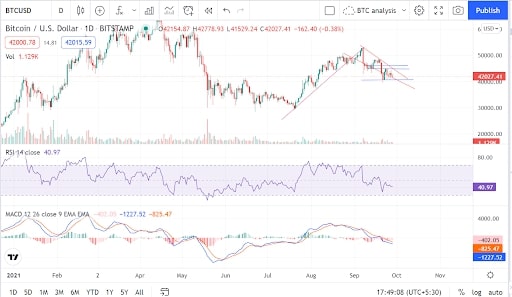
On the daily chart, RSI has placed at the level of 40, which will be considered as a buy option, and the MACD is nearing to signal line. A cross-over of MACD to the signal line can further move Bitcoin in the coming days, and traders can expect a bullish trend until the next resistance level. But any down move failing to withstand the level of $38000 will result in the next down of $34000 range.
The confirmation of the next side can be identified after it sustains the levels mentioned above. So, this weak will be very cautious for the bitcoin market. On the technical chart, weekly indicators also remain bullish. If the macro-environment favors, then BTC will respect the technical chart and move further. Considering the technical setup and the macro-environmental condition, BTC is trading on a crucial level for this week.