Bitcoin Cash is seen drawing an intraday uptrend after a bearish trend since the beginning of the day and is currently trading at $228.95. The currency started the trading session with a bearish wedge, and simultaneously the RSI of BCH turned down from 70 to 32. The intraday has been a mix of trends and a gainer ultimately as it rises above the support at $226.
Bitcoin Cash Price Analysis
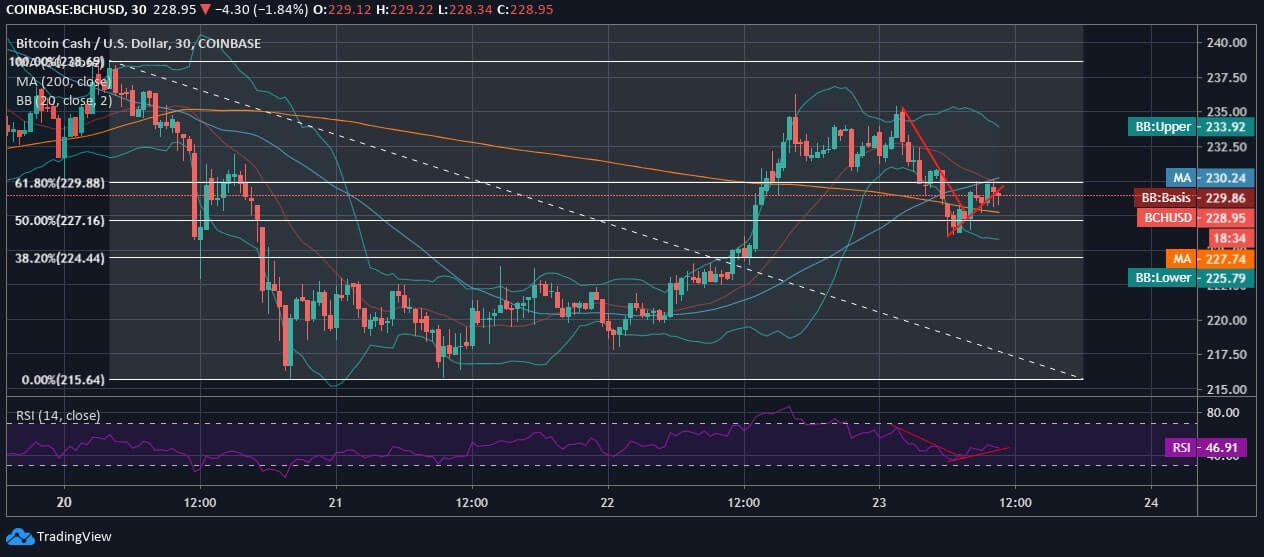
On a half-hourly chart, Bitcoin Cash appears moderately volatile against the US Dollar, after bottoming out at $215 over the past two days. The 20-day Bollinger Bands are seen widening, holding moderate volatility for BCH, and therefore, it fails to retain support from 50-day MA lying at $230 while regains support from 200-day MA at $227.74. As per Bitcoin Cash forecast, the intraday support lies at $226, and a further fall in the day is likely to turn the coin bearish where $220 happens to be the major support to watch out for.
However, after BCH/USD had an intraday trend reversal, the candlestick is making an attempt to rise above 61.80% Fib retracement level, after a gradual spike above 50.0% Fib. Over the past three days, BCH has been exhibiting a mix of trends, starting from a notable dip to price accumulation and a bullish wedge thereafter. The resistance to watch out for lies at $235 for the Bitcoin Cash to turn bullish or appear as a gainer. The technical outlook confirms the positive intraday move as RSI rose from 35 to currently draw an uptrend at 46.91.