The cryptocurrency market kickstarted a fresh correction trend following Wednesday’s U.S. Fed rate cut decision. Today, Bitcoin price plunged below $100k and bolstered market-wide selling pressure. Amid the bearish momentum, the Ethereum price recorded a major pullback with a bearish pattern formation, signaling further fall. Will the ETH coin lose a $3,000 floor, or are buyers waiting for a counterattack?
Currently, the ETH price trades at $3,502 with an intraday loss of 4%. According to Coingecko, the global crypto market cap is at $3.5 Trillion, while the 24-hour trading volume is at $384.2 Billion.
Key Highlights:
- The formation of a double-top pattern drives the current correction trend in ETH.
- The Ethereum price correction experiencing a surge in whale accumulation hints at a potential for quick recovery.
- The $3,500 level, backed by a 50-day exponential moving average, creates a strong demand zone for crypto buyers.
Ethereum Price Retain Buy-the-Dip Sentiment
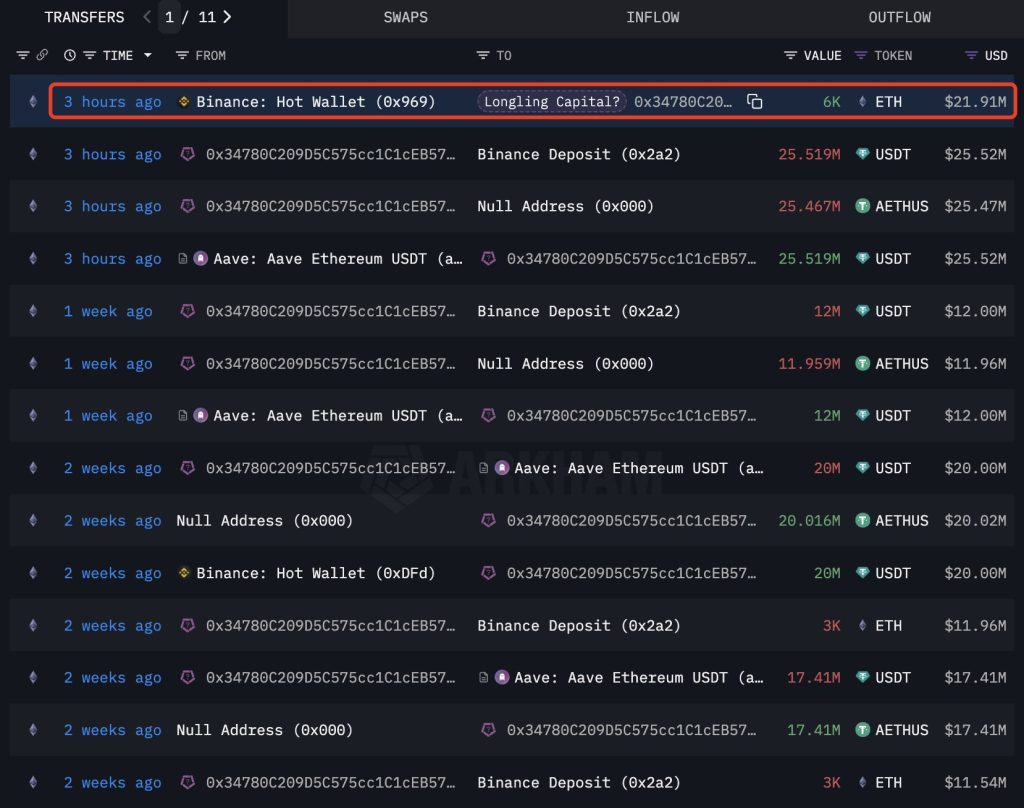
According to lookonchain data, an Ethereum whale, potentially linked to Longling Capital, has acquired 6,000 ETH following the recent price drop. Known for strategic trading, this entity has a proven track record of buying Ethereum at low prices and selling at peaks, amassing a total profit of $83 million.
Since May 8, 2023, the whale has purchased 75,400 ETH worth $180.4 million at an average price of $2,392 and sold 50,800 ETH valued at $172.8 million at an average price of $3,401.

Whale accumulation during market correction often indicates a buy-the-dip sentiment among market participants, usually recorded in an established uptrend. Thus, the Ethereum price could prevent a major drop or rebound quickly.
Double Bottom Pattern Hints Major Breakdown
Within a fortnight, the ETH price recorded two major reversals from the $4,000 level. The overhead supply evidenced by long-wick rejection has also led to double-top formation. The chart setup resembles an ‘M’ shape and is often spotted at major market tops.
With today’s market fall, the Ethereum price teases a bearish breakdown from the pattern’s $3,500 neckline. A daily candle closing below the support will accelerate the selling pressure and drive the altcoin 17% down to hit $2,700.

On a contrary note, if ETH price displays demand pressure at $3,500, the downward trajectory could extend sideways to replenish the bullish momentum for the next leap.
Also Read: BlackRock’s iShares Ethereum Trust Reaches 1M ETH as ETH eyes $6K

