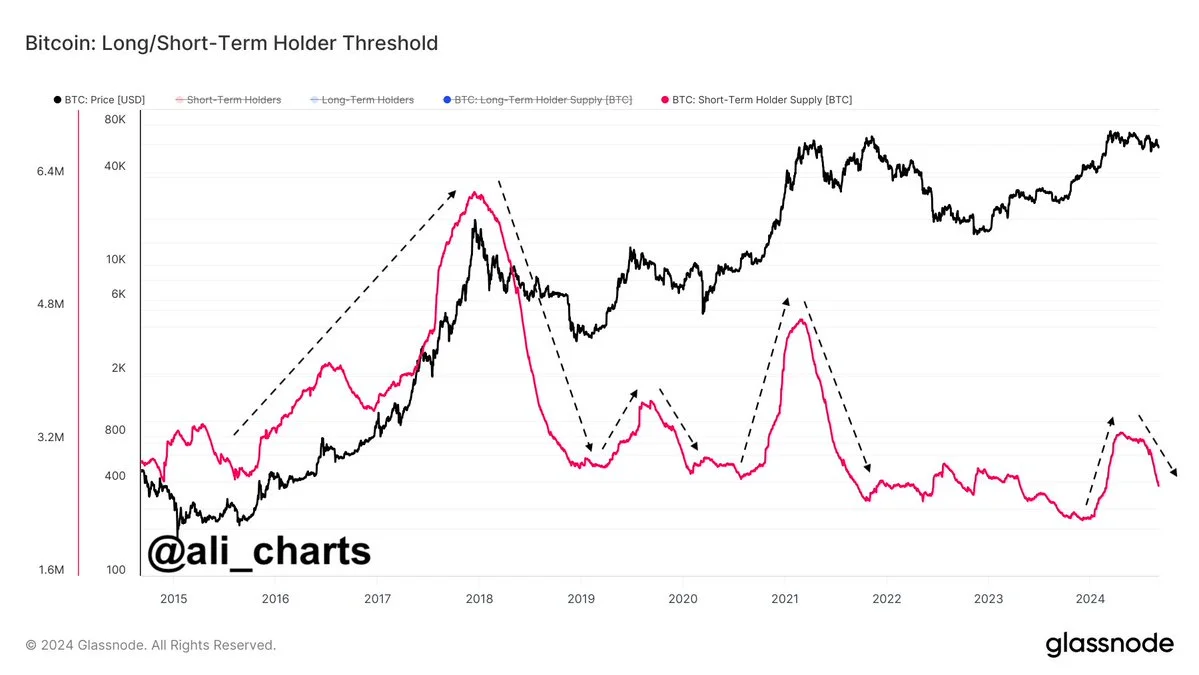
On 2nd September, Bitcoin tested a new support level at $54K but quickly recovered and is currently changing hands at $59,217.95 on 3rd September (1.11 am EST). The dip in yesterday’s price can be pointed to the current dip in the interest of short-term holders of the asset. Back in 2018, short-term holders ranged to an average of 6 million at the $38K mark of the asset. However, much has changed since then.
Bitcoin has rallied up, and as the price keeps moving upwards, short-term investors are likely having a tough time entering the market, explaining the short-term downward trend.
Source: ali-charts
While short-term holders of Bitcoin are slumping, long-term holders have remained relatively stable, meaning more investors are confident in Bitcoin’s long-term potential for returns than in its short-term potential. When looking at the MACD chart coupled with the current long-term holders, investors seem less likely to react to any short-term dips in the market. This helps Bitcoin’s price stay relatively stable, and it is expected to grow upward.

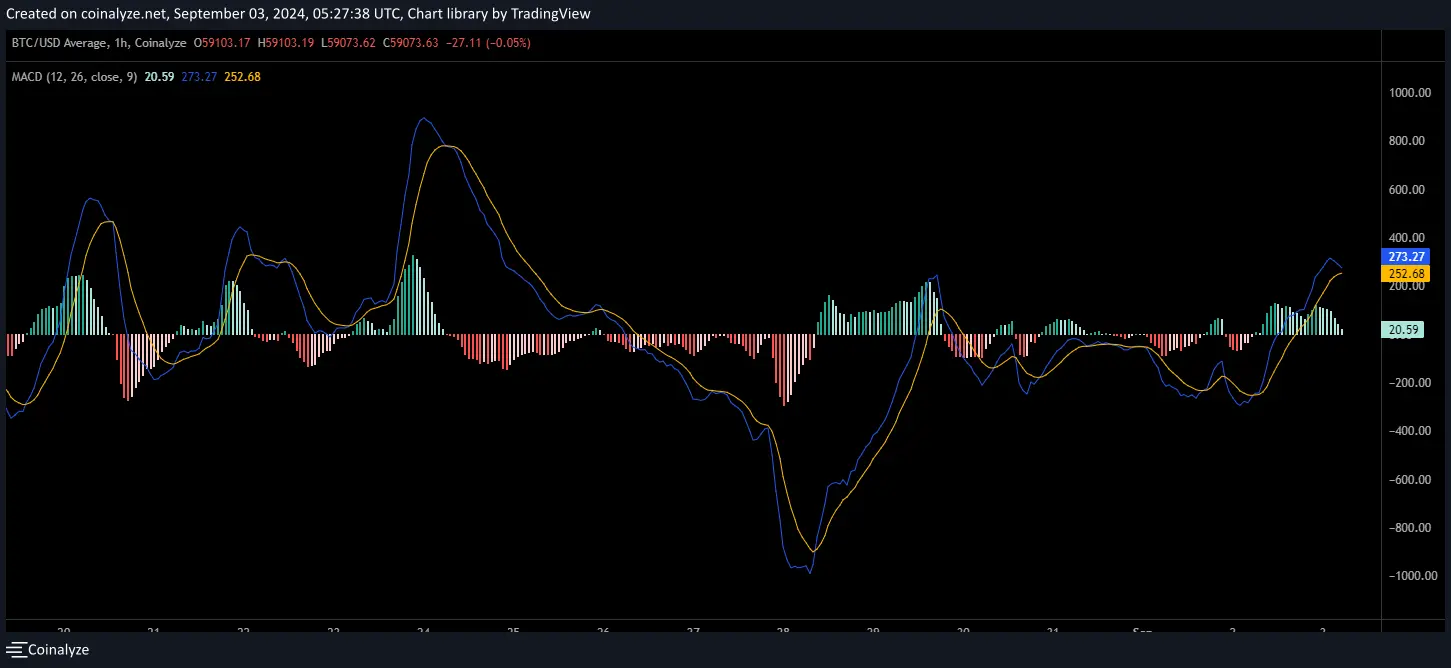
Further, the histograms in the MACD have turned green, bolstering the analysis that bullish momentum has set in. While short-term holders may be closing their positions in the market, a positive momentum shift indicates Bitcoin’s price would definitely hold above the support level this week.
However, traders need to keep an eye out for any changes between the MACD and Signal line, as a crossover going back down could tip off a trend reversal. This would mean traders would require a repositioning of their trading strategy. If the bullish momentum picks up, Bitcoin can reach the $65,000 mark this fall, according to the Bitcoin price predictions.
When looking at the RSI indicators, Bitcoin currently stands at 40.4, which indicates a slightly bearish market momentum. However, if the asset reaches 50, a renewed bullish momentum will be reinstated. For now, investors should wait and watch for the next swerve Bitcoin takes.


