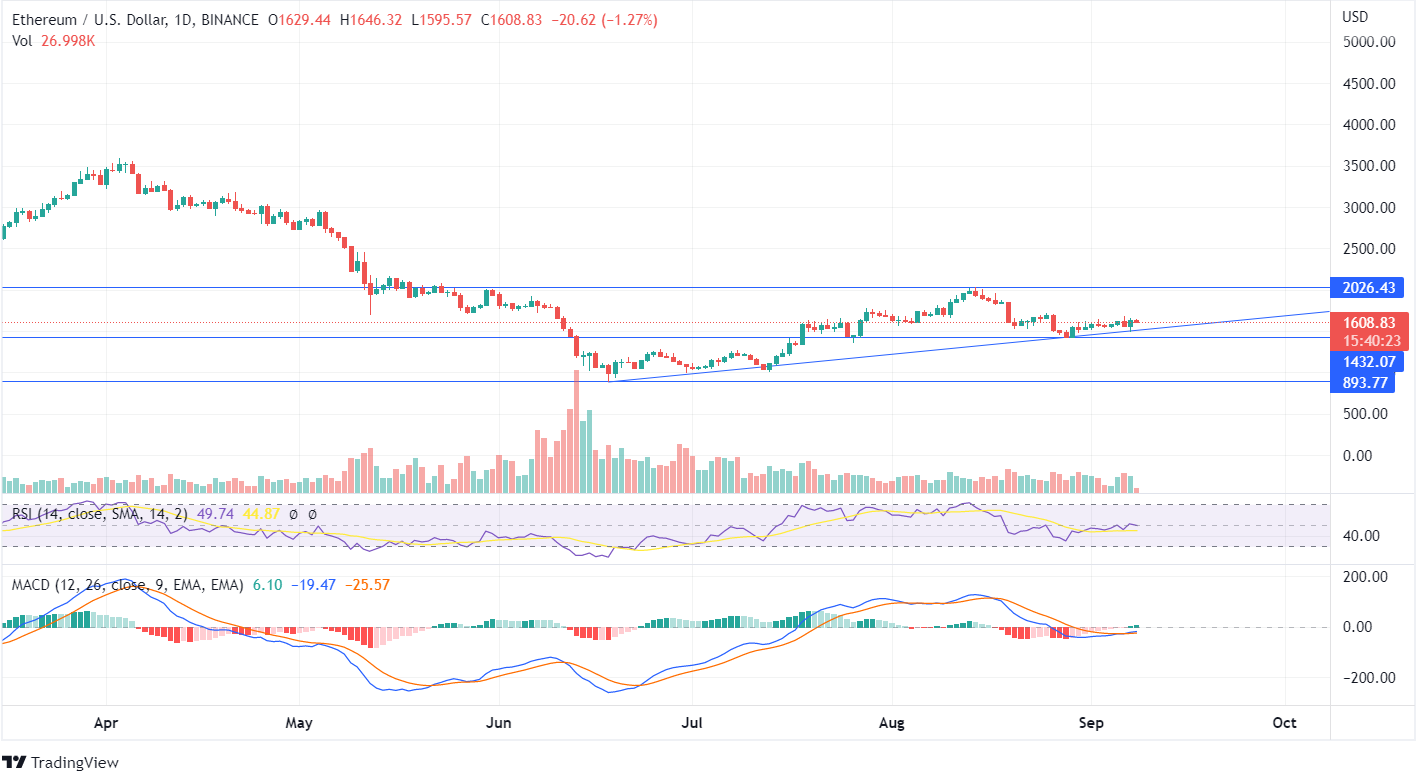
Ethereum (ETH) reached its support of $893, from where the bulls tried to push the value upside and reached the resistance point of $2026. The ETH token couldn’t close above the high of $2026, and the price began to fall.
The price of Ethereum is recently taking the support of the up-trend line. However, if the price closes below the trend line, it may reach its support. On September 7, there was a decent price movement in Ethereum, but the price couldn’t close above the previous high of $1686. Check out our ETH forecast to know the future price projections of the token.
The MACD line being ahead of the Signal Line and the histogram denoting green candles indicate an upcoming bullish trend. The RSI indicator is at 51 and shows neutrality. The volume bars being below average requires supportive buyers for a bullish trend.
On the weekly chart, the price of ETH tokens rejects the further downfall and turns from the horizontal line. The MACD indicator being in the bullish trend indicates an upside momentum. The ascending upside shows the price may reach its high of $2026.


