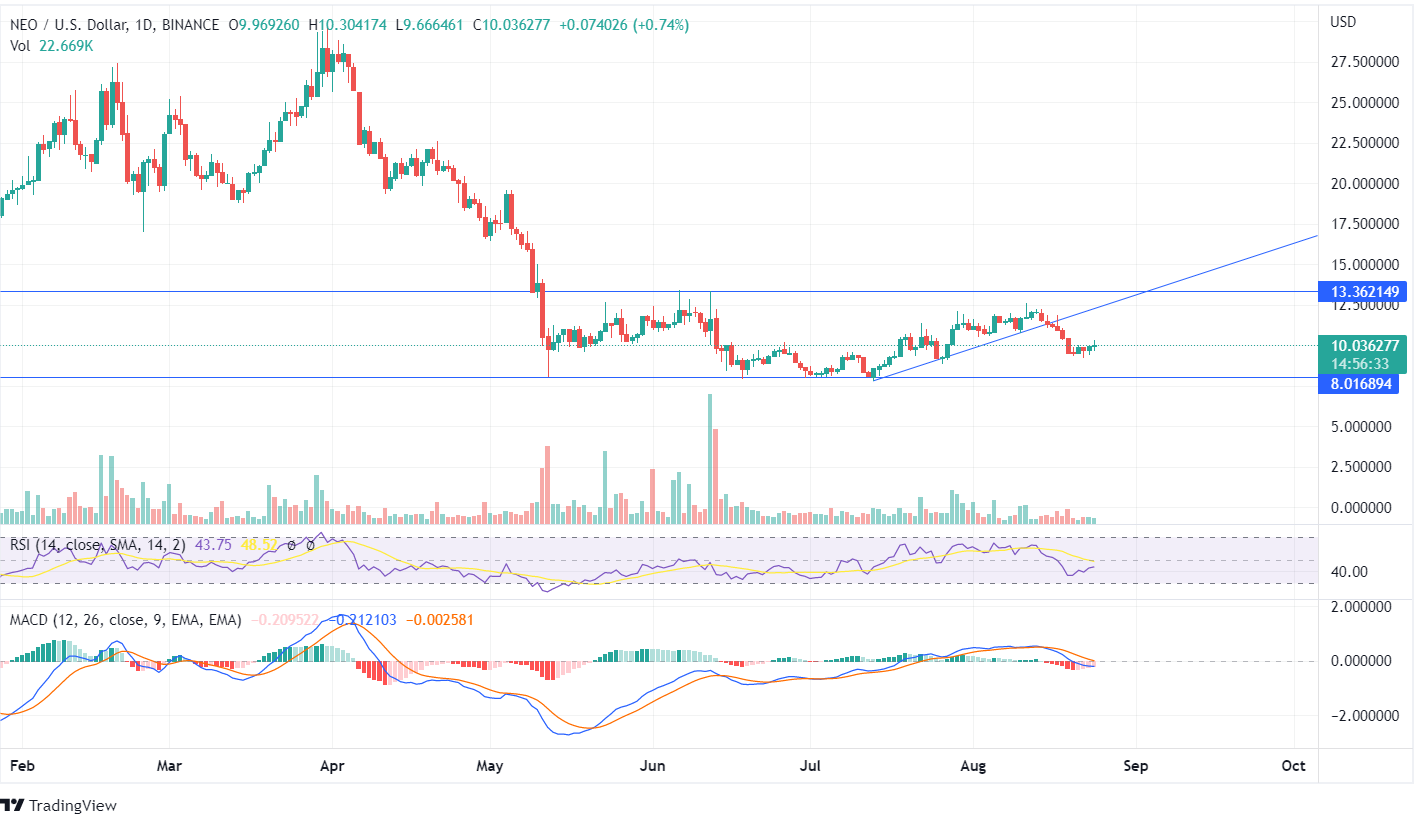
Neo price has seen a fall from its higher highs and is surfing near its lows with the current value of $10.036. The NEO token has been moving in a parallel channel as there has been isolated price movement. The bulls tried to push the price upside but couldn’t close above the last high of $12.58 and began to decline.
Yesterday, there was a marginal price movement as the bulls showed buying pressure. The Neo price recently suppressed the trend line, moved downwards from the lows, and may continue to decline further. The RSI being 43 shows neutral price movement; however, the indicator line tilts upside as the bullish candles show a rise in the price.
The MACD line is moving below the Signal Line, and the histogram shows red candles, denoting a bearish momentum. The Neo price had already declined significantly from when the MACD gave a sell signal. The volume bars move below average showing unfavorable trends towards bulls or bears, and there should be additional investors for a favorable volume.
The previous week’s bearish candle closes below the trend line vigorously after a constant formation of bullish candles from the past few weeks. There was a huge fall during the last week when the NEO price was about to hit the resistance point, but the price turned to fall downwards.
The technical parameters on the weekly chart are currently neutral. However, once the current candle is formed and the Neo price closes above or below the horizontal lines, a strong trend can be anticipated for the long duration.


