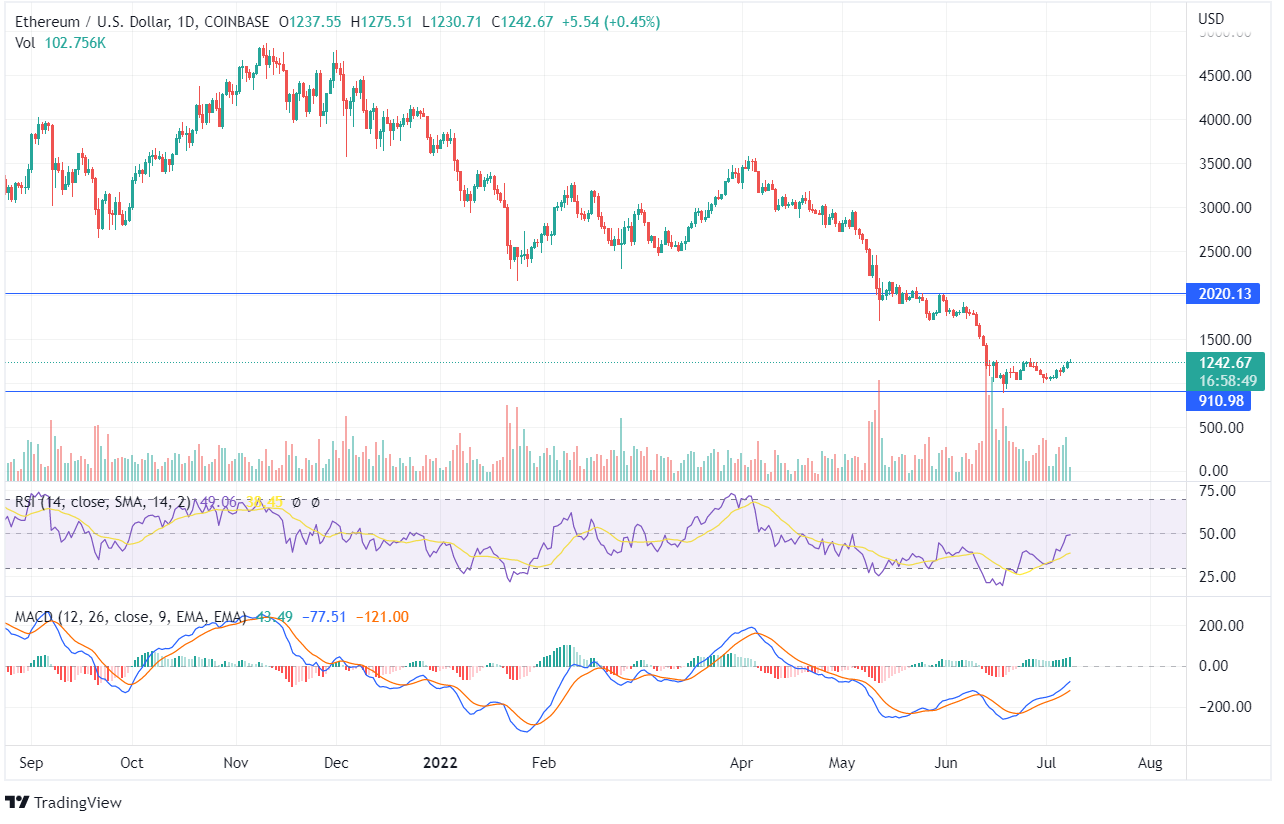
Ethereum (ETH) has constantly been falling from its highs of $4891 to the current market price of $1242. The token recently took a U-turn from its support zone of $910 as the price declined further. Like other crypto assets, ETH has been forming lower lows as the crypto market continues to collapse over the past few weeks.
The Ethereum token had reached its 52-week low of $896 on June 18, but now a significant turnaround is expected. As the ETH price turned from its lows, there was the formation of Doji candles, followed by the formation of bullish candles.
On July 07, there was a marginal hike, giving the bulls hope for an upsurge. Find out if the coin will continue the upsurge in our Ethereum prediction.
The ETH value has entered the oversold zone twice on the daily chart; however, it is currently trying to move into the overbought zone. The RSI is at 49, showing neutral price action. Once the token forms a higher high above the last high of $2020, a bullish trend can be expected. The MACD line has been trading above the Signal Line for the past few days, and the histogram chart denotes green candles, indicating bullish momentum.
On the weekly chart, the price has been in the bearish zone for the past few weeks. In the last week, there was a huge downfall. The indicators show a turn towards an uptrend as the bulls push the price up.
The aggressive traders may have already entered the trade; however, the investors can wait for the price to close above the last high of $1280.


