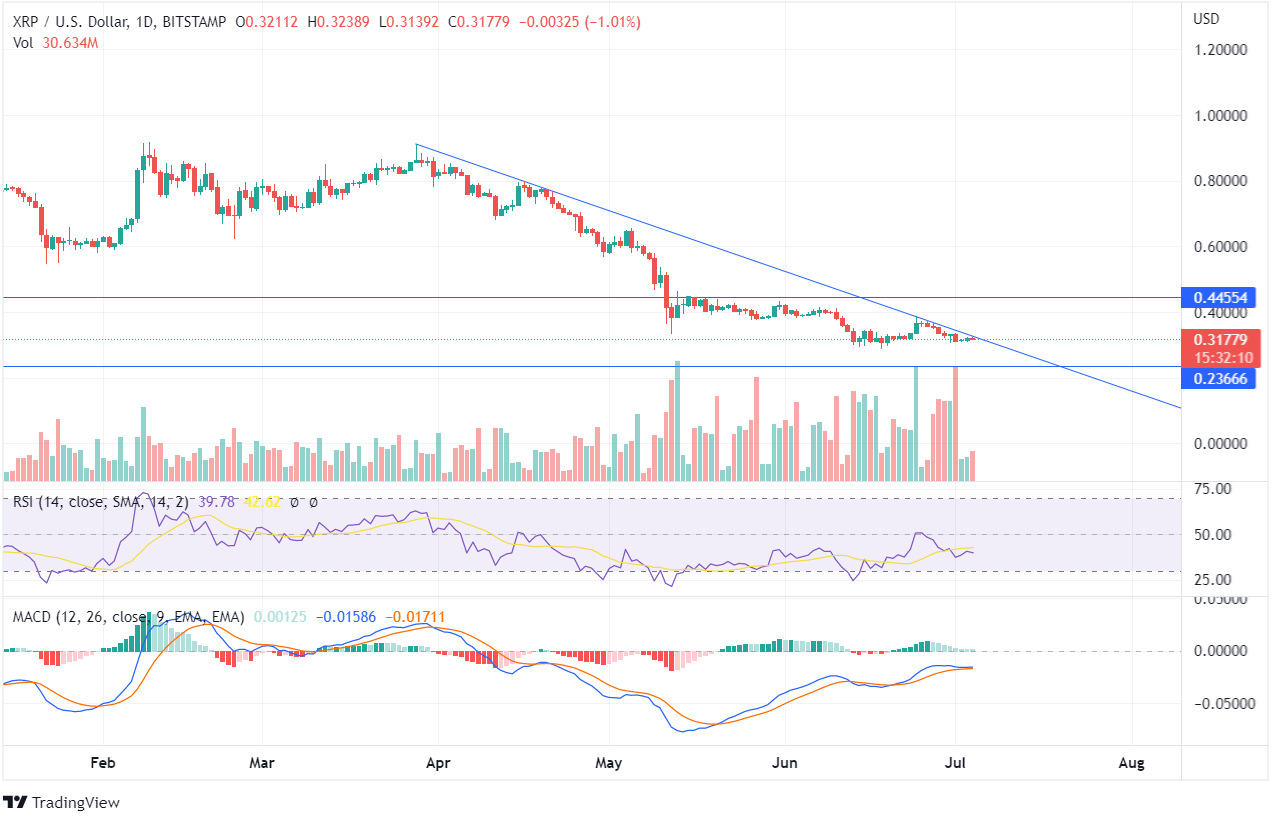
XRP has been forming lower lows as it dropped from its resistance of $1.35 a few months ago and is currently trading at the value of $0.317. The XRP token has been moving sideways in the price range of $0.44 and $0.23 for the past few weeks, not showing any major price action.
Once the XRP token closes above the immediate resistance of $0.44 or below the immediate support of $0.23, a strong price trend can be expected in the long run. The current price is moving below the trend line, and though the price got tested several times but couldn’t uplift and is moving in consolidated momentum.
In mid-June, the XRP coin entered the oversold zone, indicating negative momentum. While the RSI indicator is currently at 39, giving neutral price momentum. If the XRP price continues to fall, it may re-enter the oversold zone.
The volume bars on the daily chart show favorable bearish support, and the bears may continue to push the token down like other cryptos. Currently, the Signal line and the MACD line have overlapped each other, indicating a neutral momentum. This indicates that there are equal opportunities for the XRP value to move in any direction.
The previous week’s candle shows a significant downfall on the weekly chart. Technicals are in the bearish zone. XRP price prediction may continue to be in the ‘Sell’ zone till the token reaches the support zone of $0.23, from where major price action can be expected.


