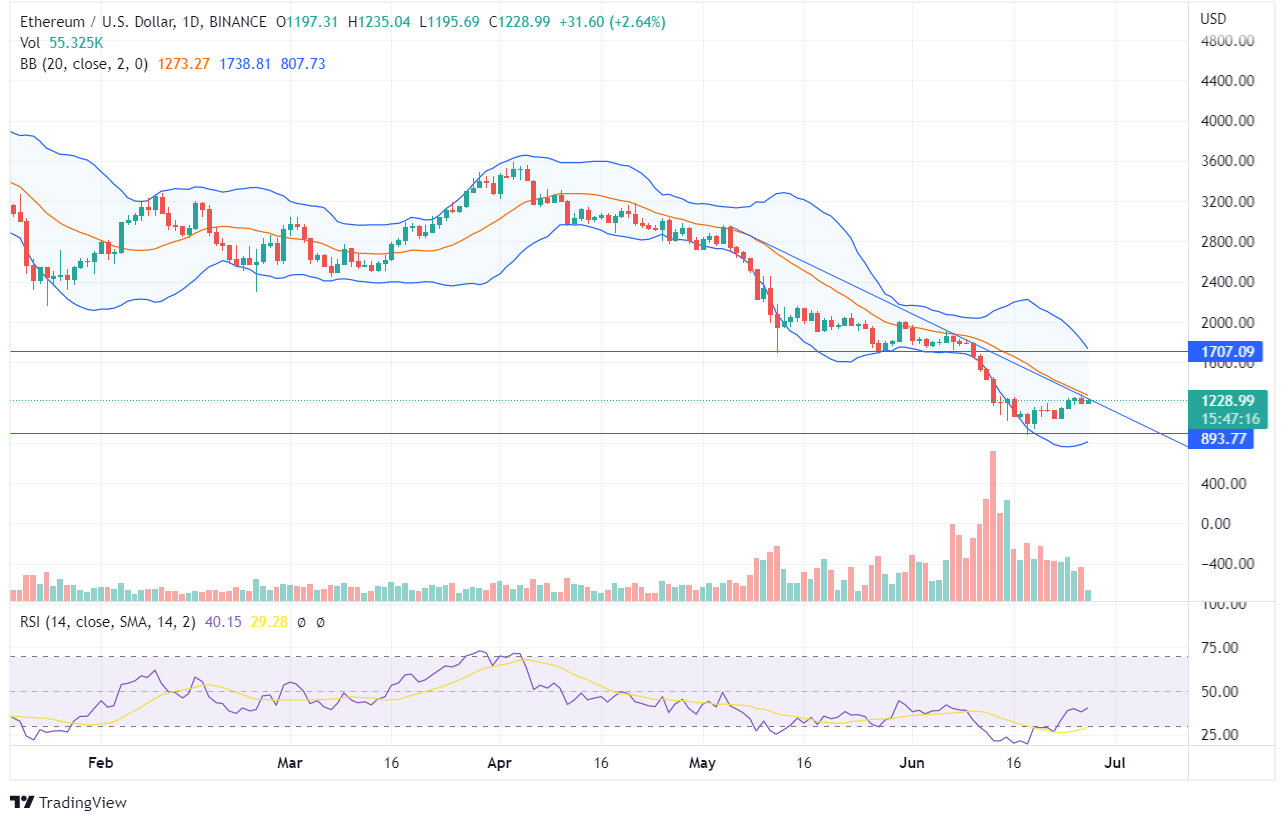
Ethereum has been dropping from its highs of $4891 and has currently reached the market price of $1228. The bears kept the downside momentum from the past few weeks, and the token reached its support line of $893. However, the price could not close below it and took a turn around, heading towards its highs.
An impending surge can be expected once the ETH token closes above the downtrend line and the price enters the upward region. The price recently rejected the lower band of Bollinger Bands on the daily chart for the further decline giving the bulls an opportunity. The Ethereum price is currently moving between the Bollinger Bands and may head upside if the bulls continue pushing the price up.
The ETH token entered the oversold zone in mid-June, later taking a U-turn towards overbought. The RSI indicator at 40 currently shows neutral price momentum, and the Ethereum price is moving at the edges of the trendline showing sideways momentum. This shows a tiff between bulls and bears, as they are unable to decide the future price action.
On Jun 26, there was a marginal price movement as the bears pushed the price downward. The ETH token had immense selling pressure on Jun 13, after which the token value reduced significantly. If the token continues to rise, it may reach its immediate resistance of $1707, as indicated by the Ethereum forecast.
On the weekly chart, there has been a constant formation of bearish candles since Apr 4. In the last week, the bulls showed positive sentiments forming the bullish candle as the price took a U-turn from the support line.
The indicators are in the bearish zone; however, it may turn from its lows as the price has reached the same zone from where it surged towards its highs in the past.


