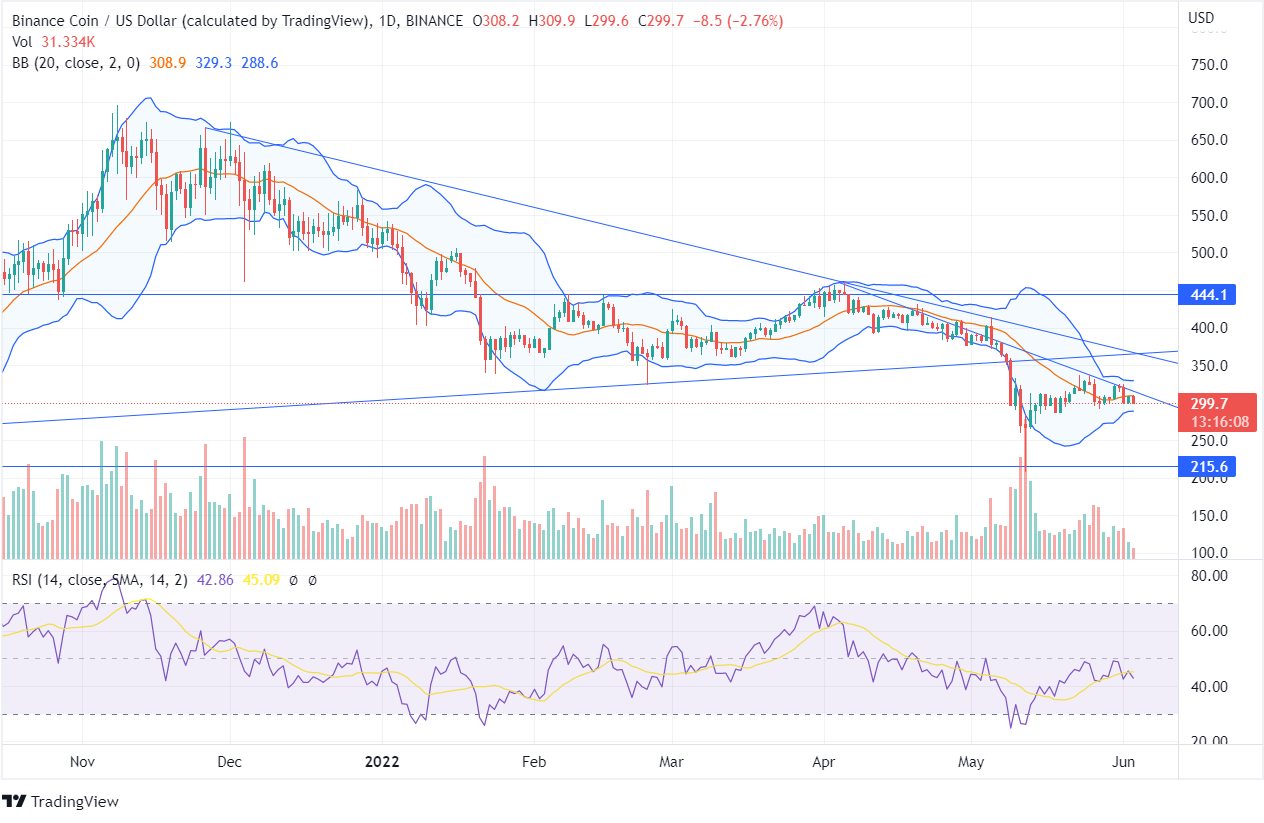
BNB was at its high of $650 in November 2021, after which the coin has been declining, and the price reached its support zone with the current price of $296. The token has been moving below the downtrend line for the past few months. However, the price tried to traverse the downtrend line and close above it on June 01 but got rejected and declined further.
On June 01, the BNB price had reduced significantly. The price has taken a U-turn after reaching the oversold zone, and if the bulls push the price up, the token may head towards the overbought zone. The RSI indicator, currently at 42, shows a neutral momentum as the forming candles are moving sideways.
A bullish opportunity can be expected once the BNB price closes above the recent high of $337 while supressing the downtrend line. There was a formation of a bearish engulfing pattern; however, if the price closes below the low of $215, a robust bearish momentum can be expected in the future. The BNB price is moving in between the Bollinger Bands after facing rejection at the lower bands.
On the weekly chart, the price hasn’t yet reached the oversold zone though it has a constant fall towards its support line in the second week of May. The price moving at the edges of the trend line on the weekly chart shows a deteriorating price action.
The price is trailing at the edges of the lower bands and hasn’t yet closed below the lower band. The technical parameters in the long time frame chart show the BNB price is moving towards its lows, and the bulls need to give a major price push.


