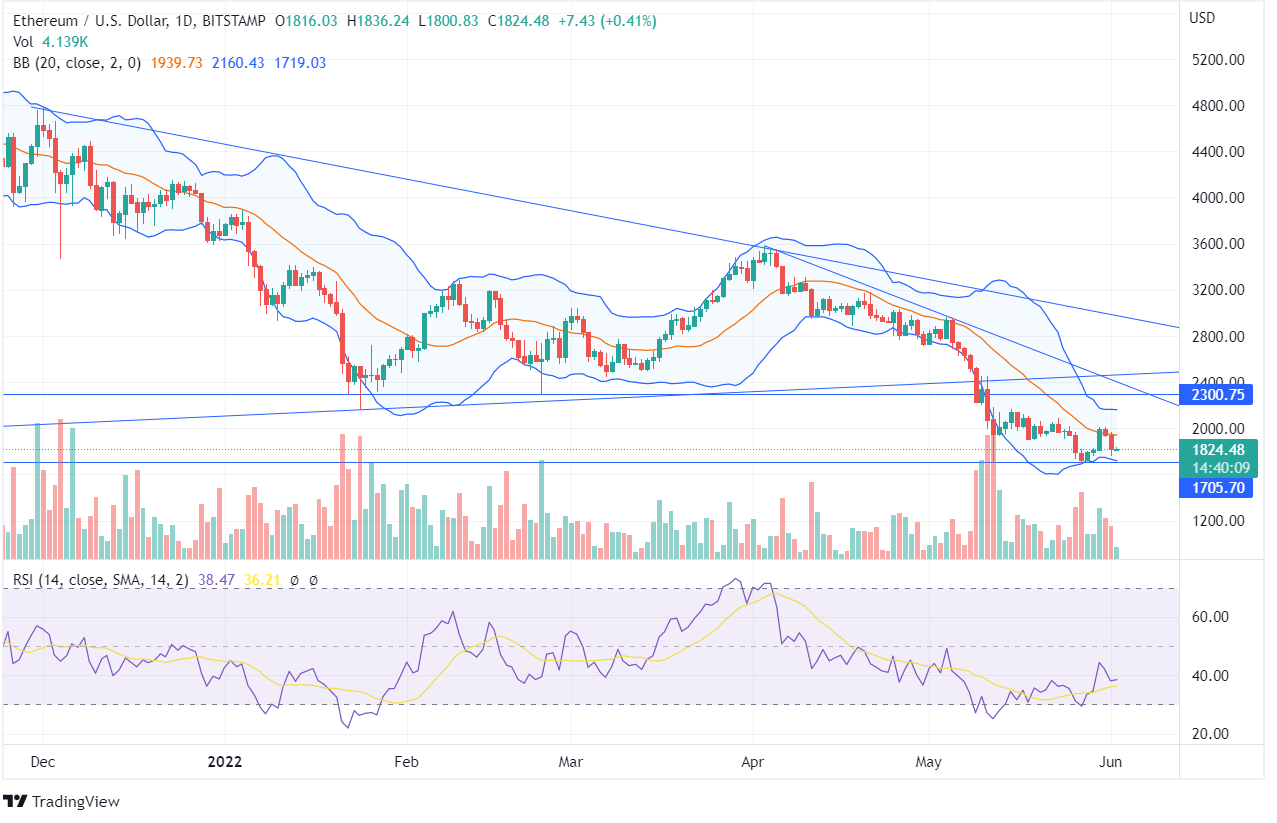
Ethereum reached its Support Line of $1705 and got tested there but couldn’t close below it. After that, the bullish candles were formed as the ETH price climbed up. However, from May 31, there has been a formation of bearish candles, and the price declined.
Ethereum price is currently trailing at $1824, and an uptrend pattern can be expected once the price closes above the $2015 level. ETH has reached near its 52-week low of $1700, and the price recently began to mount from this support line extending over from year.
The ETH price was taking the support of the uptrend line and was heading towards the highs until May, after which the price closed below the trend line and has constantly been declining. As the price has reached its crucial support zone, ETH may rise if the bulls show positive sentiment and buyers initiate some accumulation. Check out Ethereum price prediction to know whether your money invested in ETH will increase or not!
The ETH price reached its oversold zone on the daily chart and was heading towards the overbought zone. The RSI indicator is at 38, currently in neutral momentum. However, if the Ethereum price continues to rise and close above the high of $2015, it will reach its overbought zone in the coming future.
The ETH price has recently touched the lower band of Bollinger Bands; however, the narrow bands indicate less volatility in the market. On May 30, the volume bar was favorable towards the bulls, and the price rose significantly.
On the weekly chart, there has been a continuous formation of bearish candles since April 4, and the forming bullish candle may expect a hike in the price. If the price continues to grow from this point and closes above the top horizontal line of $2300, it may hit its weekly downtrend line.
ETH price is moving at the edges of the lower Bollinger Bands. However, the price showing rejection at the lower band can be a signal for bullish traders.


