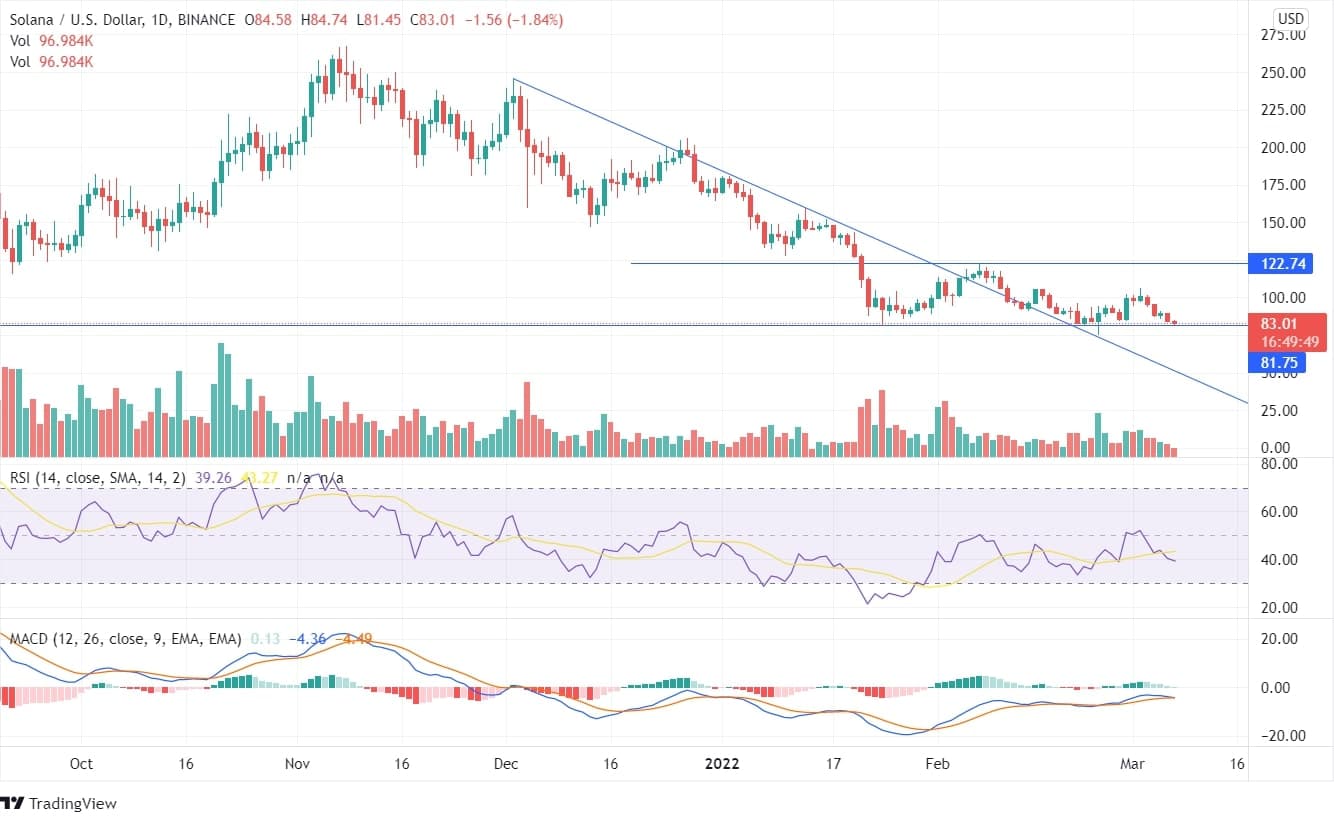
Solana was at its highs in the last November, after which it is constantly falling at its support zone. The coin is correcting with the a lower low formation. The coin is trading sideways for the last two months in the price range of $122 and $83. Recently the price got tested at the support line of $83 but couldn’t close below it. On February 28, the bulls tried to push the SOL price up, and a bullish candle was formed. The price ascended 21% on that day, but the bulls couldn’t close the price above $106, and the bearish candles were formed after that taking the price back to the bottom horizontal line.

If we look at the weekly time-frame, the previous week’s candle shows that though the bulls tried to push the price up but couldn’t close the price near to high and the bears moved the price down. The price is close nearby to where it opened. An overall price movement of 26% in the previous week’s candle. The forming candle is moving at the edges of the support line, and once the price closes below the support line of $83, a downside pattern can be expected. However, if the Solana price closes above the swing high of $106, it may reach to a minimum of $122 and once it closes above $122 a strong long term bullish trend can be expected.

