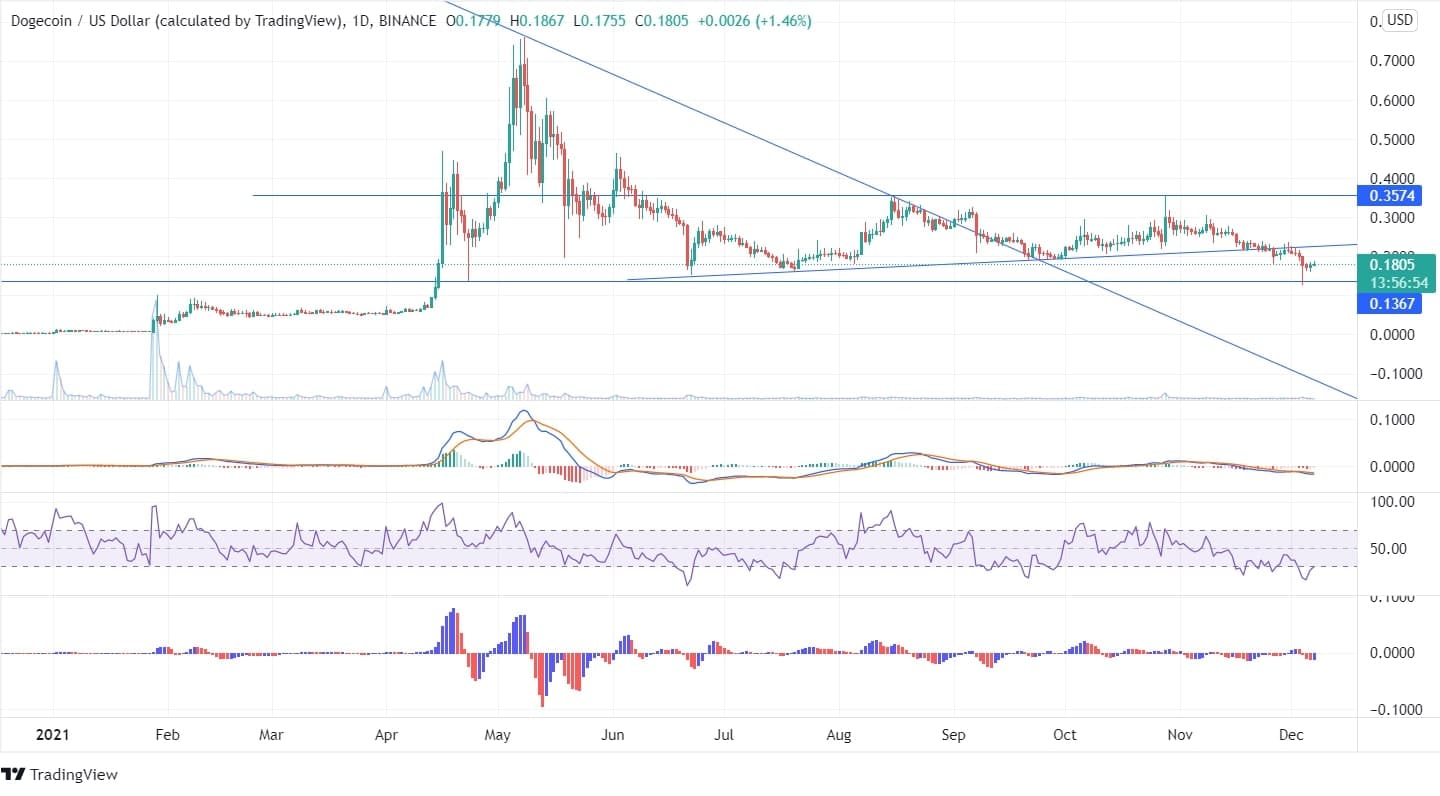
Dogecoin is moving sideways after crossing the triangle pattern formed. DOGE moving sideways within a specific price range demonstrates that the cryptocurrency is not able to cross its crucial resistance of $0.35. After hitting $0.35 in October, DOGE faced rejection and continued to trade bearishly. On the downside, if it continues to trade downwards, the coin might retest its major support level of $0.14 in the upcoming days.

The swing low formed on December 04 in the bearish candle clears that the bears couldn’t close the price at its low, and also, the upcoming candles being formed above its low signifies that the price couldn’t descend further.
In the weekly chart, the coin has already started to rise from its support level. If the upcoming candles surpass the trend line and move upside, an augment in price can be expected in the future with a minimum target of $0.35, and if the price reaches $0.35, it may further move to its highs of $0.75 in the long term. Looking for future growth, it’s an opportunity for the bulls to buy the crypto at discounted rates as the market is on its way to recovering and reaching its highs.

