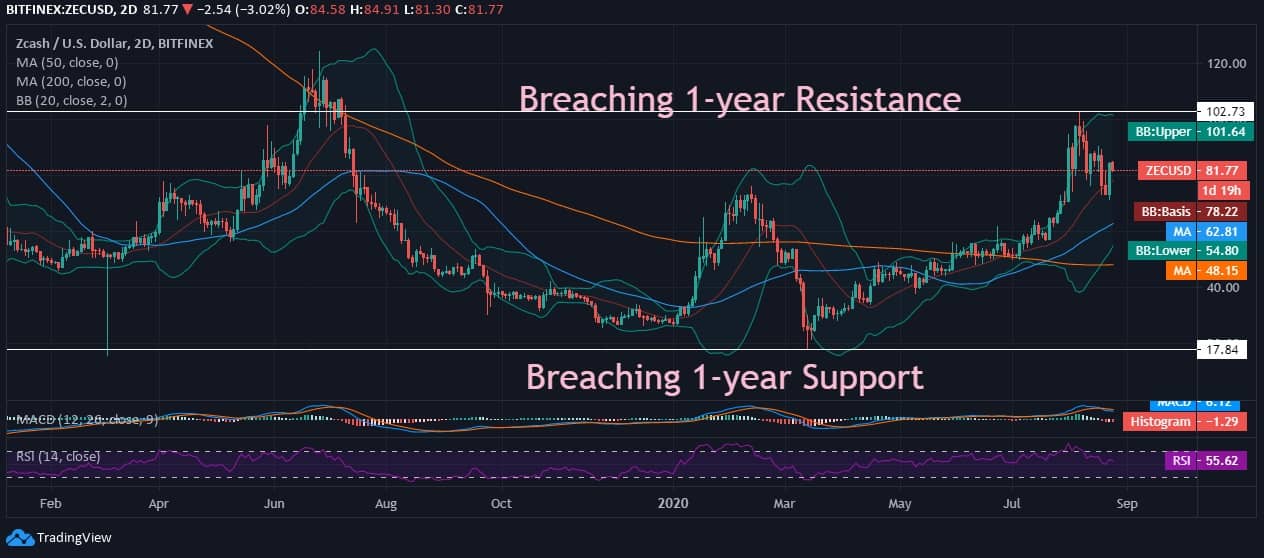
Zcash—one of the top 30 cryptos of the global market, is currently trading slightly above $80 at $81 after breaching a year-long resistance above $100 at $102. Zcash, with a massive market cap of over $800 million, has notably dipped by over 20% in approximately three weeks and is now below $100 & $90 due to volatile pullback in the market. ZEC appears not so volatile on the 2-day chart with constant support from 50-day & 200-day daily MA at $62 & $48.
Zcash Price Analysis

Zcash, after breaching the major resistance above $100, is now trading below $90 with a bearish intraday candlewick on the daily chart. ZEC/USD price trend after breaching the upper Bollinger Band on the 2-day chart is back to trading within the range due to daily corrections; however, the bands appear moderately widening. However, as per ZEC Price Forecast, it is a good time to plan long-term investments in the token and save for future benefits. As far as trends are concerned, the short term is still a little bit unpredictable. We can also expect that the price will increase by the end of this year.
Moreover, five months before the coin struck to 1-year resistance, Zcash had tested supports as low as $17 just when the massive sell-off happened in March due to Coronavirus Outbreak. However, right after hitting the yearly lows, ZEC coin drew a notable uptrend on the daily chart with a bullish candlewick against the US Dollar. With constant support from the daily MAs above $50, Zcash has been strengthening with near-term volatility as per the Bollinger Bands.
Due to intraday pullback and a 20% dip in less than 20 days, Zcash is holding a bearish crossover on the MACD chart, and the signal line crosses above the MACD line. The RSI has fallen back below 70 at 55.62 due to a decrease in demand after the pullback in the last three weeks approximately.

