The crypto market is giving mixed signals. Some coins are reflecting downside momentum, and on the other hand, some altcoins are registering profit.
The current movement in the Binance Coin is moderate, and the chances of improvement are ripe. The interested traders can dig-in as the coin might give massive returns to its investors.
Binance Coin Price Analysis
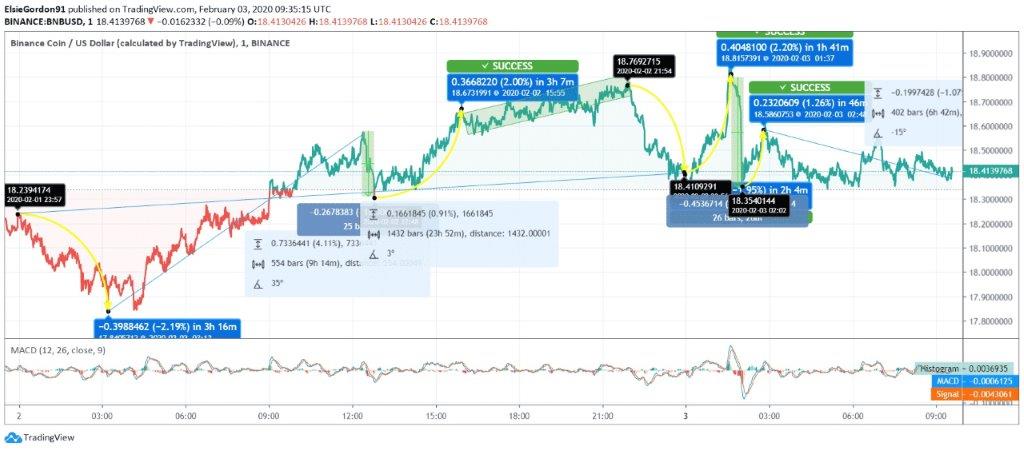
Yesterday, BNB coin started trading at $18.239. In the next 3 hours and 16 minutes, the currency moved to $17.84. The coin started showing improvement and at 12:35 UTC, the price of Binance coin was at $18.58 and then, it dropped to $18.32, but the upsurge again took the price to a new intraday high. This time, the BNB price was at $18.67.
After this moderate hike, the upside momentum remained intact, and at 21:54 UTC, the currency reached $18.76. However, the closing hours experienced a slight pullback. The price counter touched $18.41. The intraday movement in Binance Coin exhibited a marginal progression of 0.91%.
BNB/USD Price Chart
Today, the opening hours reflected heavy fluctuations. The BNB coin price moved from $18.41 to $18.81 at 01:37 UTC, and then it faced a steep fall of almost 2% and the price slipped to $18.35 at 02:02 UTC. Later, there was a slight recovery spotted in the Binance Coin. At the time of writing, the currency started showing moderate movement and it reached $18.41.
In the MACD indicator, the signal line and the MACD line intersected each other and the former overpowers the later. The same is an indication that the coin might trade downwards soon.
If the coin corrects downwards, it may find the next support around $17.98. The same might get breached in the upcoming hours. However, as per BNB Coin price prediction, the coin might reverse its momentum and trade to the immediate resistance at $18.85.
| Resistance Level | Price | Support Level | Price |
| R1 | $18.85 | S1 | $17.98 |
| R2 | $19.24 | S2 | $17.5 |
| R3 | $19.72 | S3 | $17.11 |


